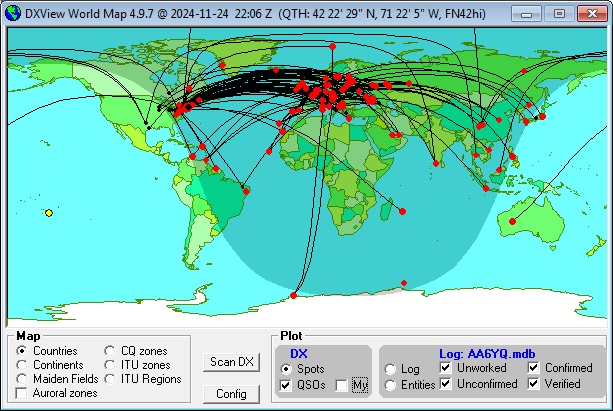
Plotting Active DX Stations and Spotting Stations on DXView's World Map
To plot active DX stations reported by SpotCollector,
At the bottom of DXView's World Map window, click the Plot panel's DX Spots button.
- To plot spotting stations and the short path between spotting stations and DX stations,
check the Plot panel's QSOs button (at the bottom of DXView's World Map window)
on the General tab of SpotCollector's Configuration window, check the General panel's Lookup missing location info box
By default, DXView uses red dots to represent logged QSOs and small black dots to represent spotting stations; you can adjust the diameters of these dots in the Graphics panel on the World Map tab of DXView's Configuration window via the DX spot diameter and QSO origin diameter settings, respectively.

If Google Earth is installed and enabled, QSOs plotted on DXView's World Map will also be plotted on Google Earth.
Actions
If you depress the Ctrl key while double-clicking a plotted DX Station on DXView's World Map, DXView will rotate your antenna to the short path heading; if you depress the Alt key, DXView will rotate your antenna to the long path heading.
If you depress the Shift key while double-clicking a plotted DX Station on DXView's World Map and PropView is running, !DXView will direct PropView to generate a propagation forecast for the DX Station's location.
Determining Which Active DX Stations are Plotted
The Configuration window's Plot Settings tab lets you limit which Active DX Stations are plotted:
the Band Filter panel limits Active DX Stations to those operating on the bands whose boxes are checked
the Mode Filter panel limits Active DX Stations to those operating in the modes whose boxes are checked
the Continent Filter panel limits Active DX Stations to those located in the geographic areas whose boxes are checked
the Origin Filter panel limits Active DX Stations to those spotted by stations located in the geographic areas whose boxes are checked
